Hadza hunter-gatherer landscape use

I’ll soon be publishing results of a long term study of Hadza spatial behavior, based on over 2,000 person-days of GPS-recorded movement. These data are beautiful to behold. A sample of tracks from one camp are shown here (men in red, women in green).

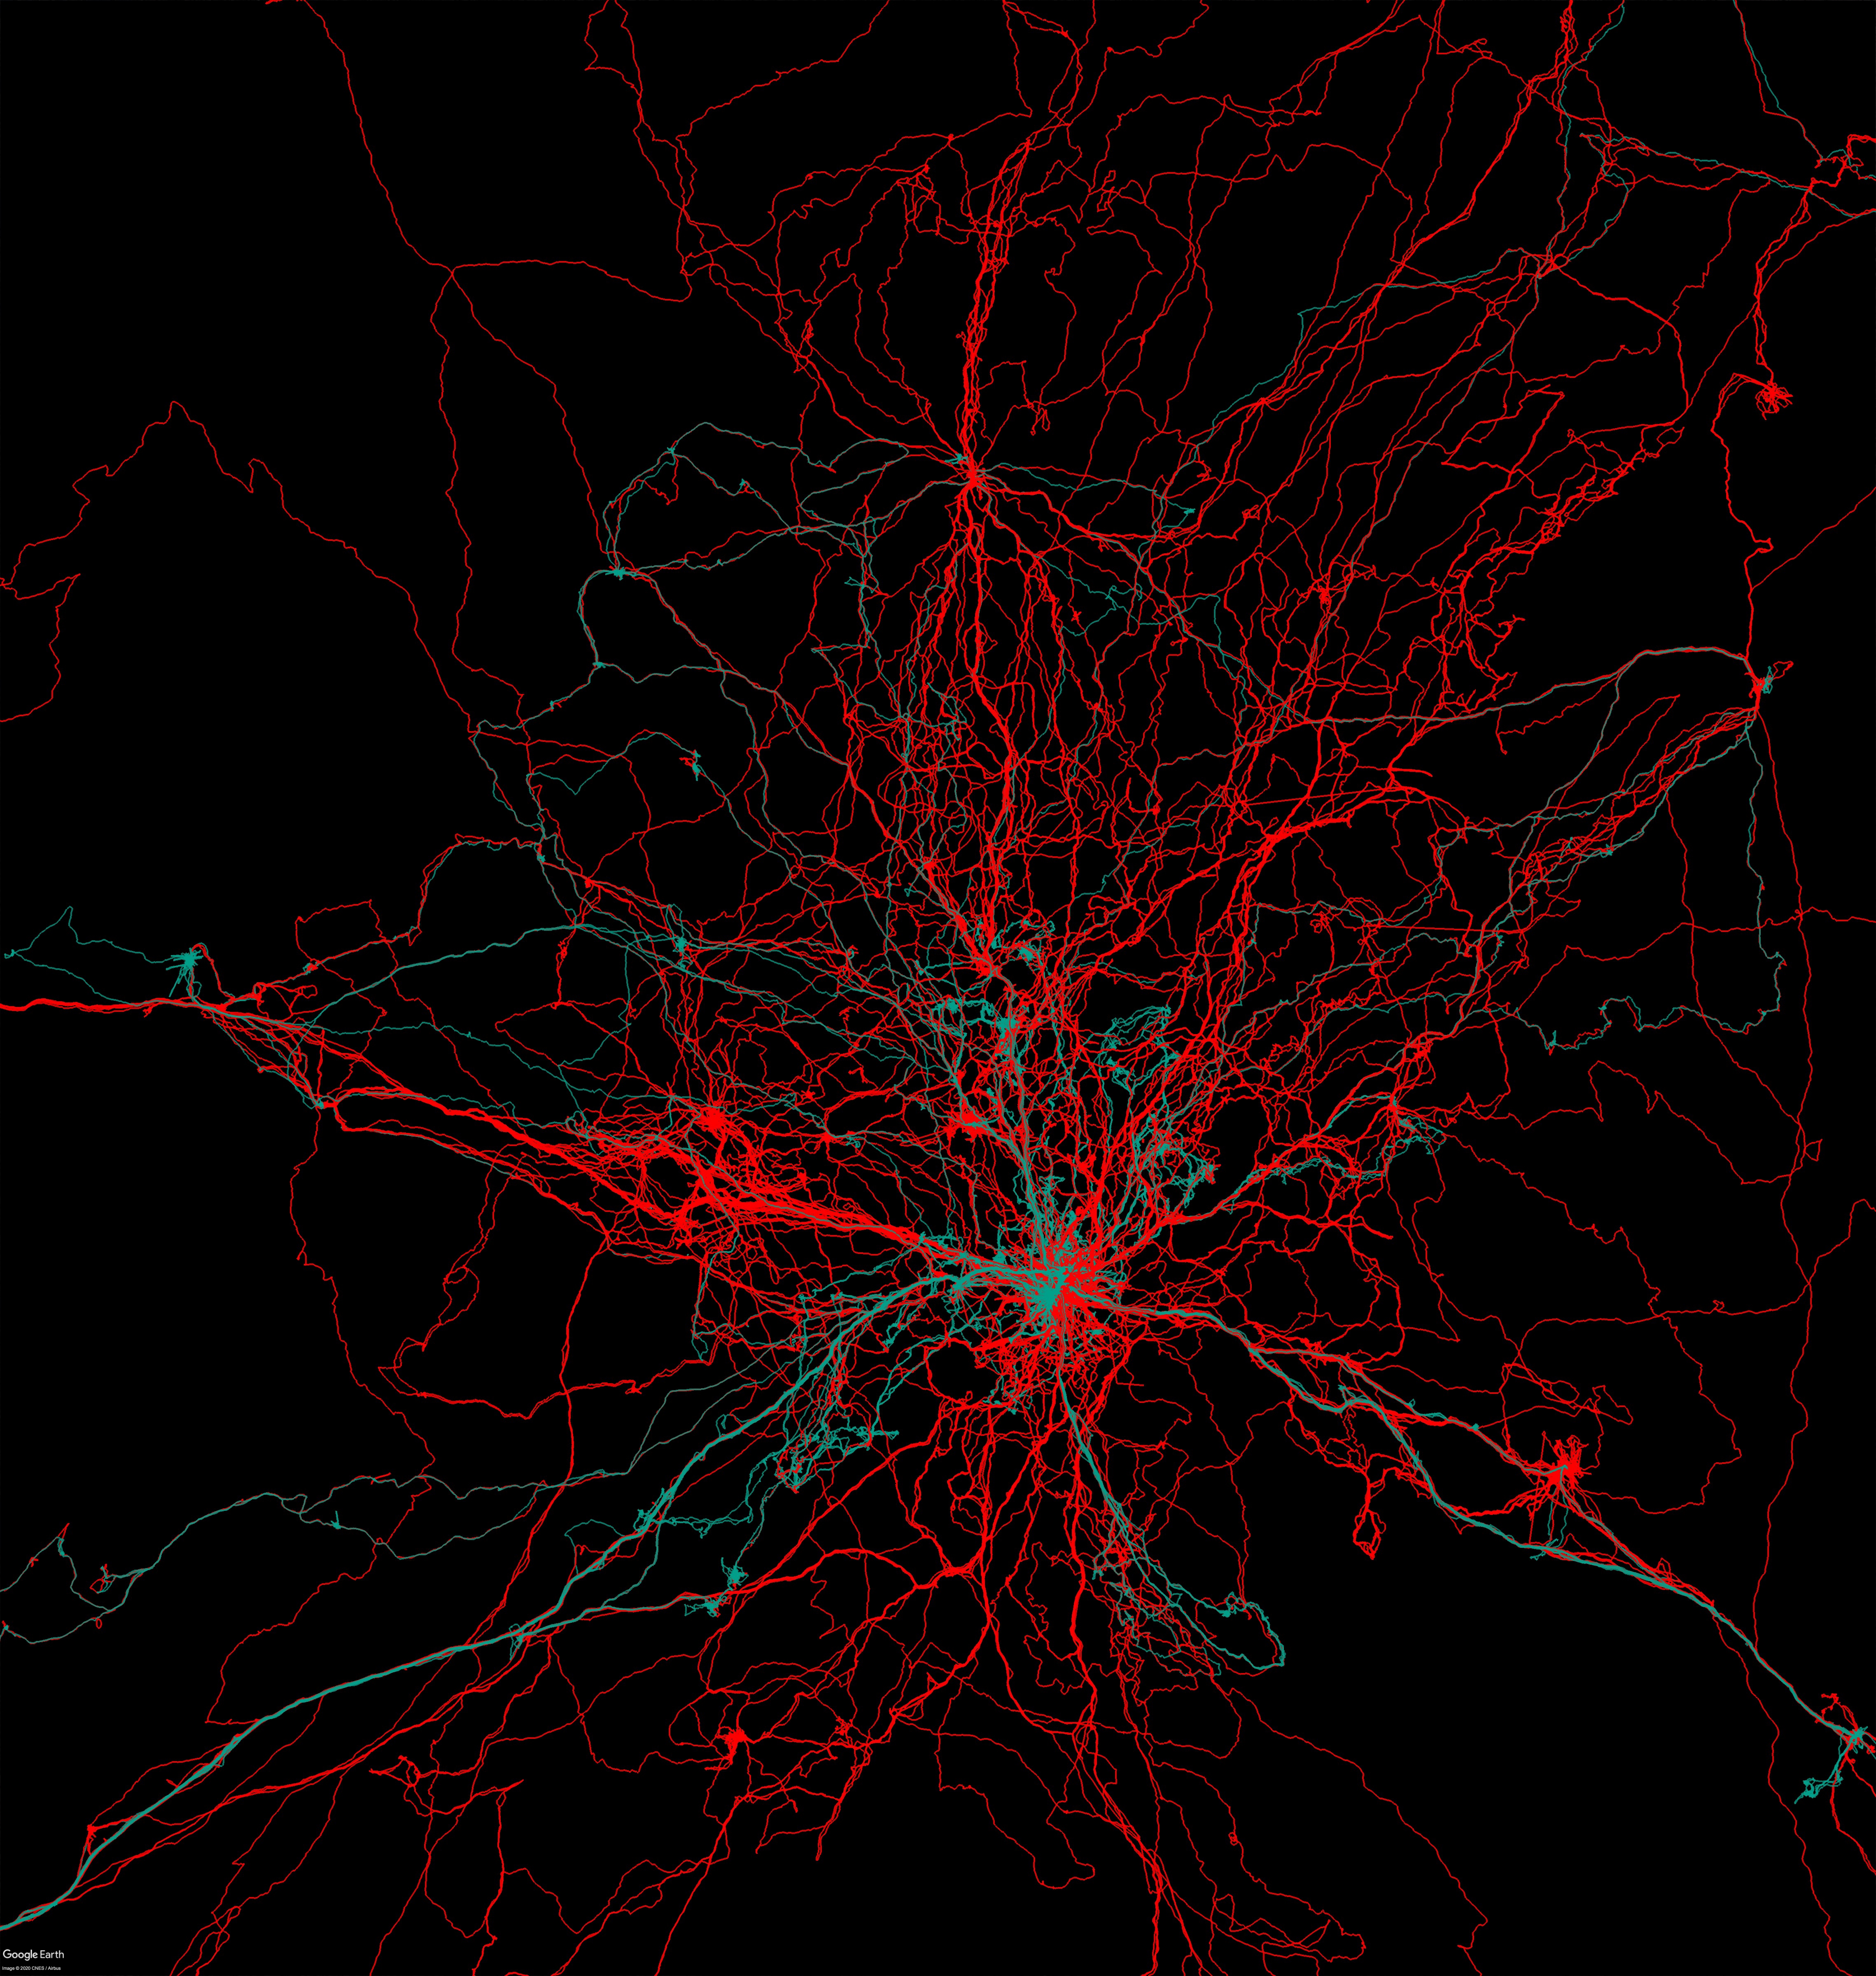
Superficially, these patterns resemble a tangle of neurons; the ‘nucleus’ at the center here is the residential camp. This isn’t something we address in this forthcoming paper but it is fun to think about. One difference between dendrites / axons and the structure of Hadza GPS traces is that Hadza foragers leave camp in the morning and then return in the afternoon or evening, creating out-and-back-again loops, something not found, I believe, in the structure of neuronal connections (I’m not a neuroscientist!). Axons and dendrites, I imagine, will also be less sinuous between any two points of connection. GPS traces often record people searching for ephemeral and mobile resources, creating densely tangled GPS traces; I’d be surprised if similar structures are seen in inter-neuron connections. Questions like these would be fun to pursue in future work with these data.

Posted in Uncategorized | Tagged | Leave a comment

Potato per capita in Africa

Rwanda has the highest population density in Africa — and also the highest potato density (i.e. kg of potatoes produced per person). As a staple crop, potatoes are nutritionally superior to grains, in that they contain vitamin C, iron, and protein. Under many conditions, potato cultivation they can be much more productive than grain production. In the UK in the 18th century, a 1/2 an acre of land under potato cultivation could sustain a family of 5 (Nunn and Qian 2011). This is what Adam Smith had to say about potatoes, in The Wealth of Nations:

–“The food produced by a field of potatoes is … much superior to what is produced by a field of wheat. … No food can afford a more decisive proof of its nourishing quality, or of its being peculiarly suitable to the health of the human constitution” – Adam Smith 1776, pp. 67–68

Posted in Uncategorized | Leave a comment

Where are what we eat

Spending by floor space at Supermarkets

I came across this intriguing image while working on a paper describing American food habits. According to an article in Business Insider, a General Mills executive showed the image above in a slide presentation describing American spending habits at Supermarkets, broken down by the prototypical supermarket floor plan. Aggregating the behavior of 300+ million Americans leads to mind boggling numbers, of course. Dry grocery is where all the pasta, breakfast cereal, crackers, chips, and soft-drinks are, and that is where Americans like myself go to get fat on cheap calories.

Posted in Uncategorized | Leave a comment

Just three countries produce half of the world’s total carbon emissions. They need to forge an agreement.

The latest IPCC report makes it completely clear that the world must reduce its carbon emissions. How can this be achieved? Every year the UN hosts a climate change conference that is meant to lead to an international agreement to curb carbon emissions. The 19th such conference took place last year in Warsaw. There were so many attendees to this conference, that it had to be held in the National Stadium. Over 10,000 attendees from 189 countries registered for the conference. For the 19th year in a row, little progress was made on establishing commitments to limit CO2 emissions. At one point, a block of 132 countries, led by China, walked out the conference in protest. These conferences aren’t working. Perhaps bigger gains could be made from a smaller gathering.

According to 2010 World Bank estimates, just three countries contribute about half of all the world’s CO2 emissions: the United States, China, and India. Obviously, for any global arrangement to be take hold, all three of these countries must agree to it. Given the enormity of their combined emissions, any agreement they can reach — even without the remaining 190 UN member states — will have a massive global impact. Instead of gathering all the world’s nations in a football stadium, it would seem to make better sense to develop a diplomatic framework for re-occurring meetings between these three nations focused on carbon emissions. Image

Posted in Uncategorized | Tagged , , | Leave a comment

Japan Age Sex Pyramids 1950-2010

Japan Age Sex Pyramids 1950-2010

Watch the oldest population in the world take shape. Japanese demographic data from UN Population Division

Posted in Uncategorized | Tagged , , , , | Leave a comment

A strong relationship between temperature and mortality

I collated 2012 data from NOAA for the average monthly temperature in the lower 48, and from the CDC for the monthly crude death rate. I find it quite amazing to see how strong a correlation there is between these two variables; temperature “explains” 97 percent of the variance in this case. The causal mechanisms underlying this relationship are certainly more complex than this simple plot admits. But for now, I’ll just post this as a compelling example of how important environmental variables are in understanding human behavior and demography.CDR and Temp Lines CDR and Temp, 2012

Posted in Uncategorized | 1 Comment

A morpheme’s menagerie

While wandering through an etymological wormhole I came across Ware’s 1760 “A New General English Dictionary: Peculiarly Calculated for the Use and Improvement of Such as are Unacquainted with the Learned Languages”. I like the lexical company that anthropology keeps here. The entire book is available free here

A page of definitions

Posted in Uncategorized | Leave a comment

Sting Operation Demonstrates the Value of Journal Impact Factors

The recent sting operation carried out by  John Bohannan of Science focuses needed attention on the shadiest practices of academic publishing. As described in his great article, Bohannan submitted a faked cancer study, riddled with errors, to 314 open access journals. The sad outcome is that 157 of the journals accepted the paper for publication. 

I was curious to find out whether Journal Impact Factors, a commonly used quantitative measure of a journal’s influence (and thus prestige), would predict whether the fake article would be accepted for publication or not. Lucky for me and anyone interested in this topic, Bohannan and Science have made a summary of their data available for download

I cross-referenced the list of journals that received the spoof paper to the Thompson Reuters Journal Citations Reports (JCR) Science Edition 2012 database.  I found that the great majority of the journals that received the article are not even listed or tracked in the JCR Science database: only 44 (14%) of the journals had an entry in the JCR database. While 57% of the journals without a listing in JCR Science accepted the paper, only 7% (n=3) of those in the database did so. The two pie-charts below illustrate the outcomes of submissions to journals listed and unlisted by the JCR Science database:

Image


Image

Since only 3 of the journals listed in the JCR Science database accepted the paper, it is difficult to make generalizations about the characteristics of such journals. Bohannan includes in his article excerpts of emails with the editor of one of these journals, Journal of International Medical Research, who takes “full responsibility” for the poor editing. 

With the caveat that samples sizes are really small, I compared the 2012 impact factors of listed journals who accepted the paper (n=3) with those who rejected it (n=34). The median impact factor of accepting journals was 0.994 and those who rejected was 1.3075 (p <.05 in a two-tailed t-test). 

The larger take away lesson, as I see it, is that journal impact factors are valuable, and are not just a guide to the likely influence of a paper, but also to the quality of the review process in place.


Posted in Uncategorized | Tagged , , , , | 9 Comments